We show every signal…even the losing ones.
Before the open, our models scan 7,000+ U.S. securities and flag the strongest buy setups. Every signal follows the same rules from entry to exit — win or lose, it counts.
See the scorecard- Over three years:
- Supportive 61%
- Mixed 26%
- Defensive 13%
1 in 8 sessions over the last three years read like this.
Earlier sessions show today’s model applied to past data.
Inside the app
See what’s behind every signal.
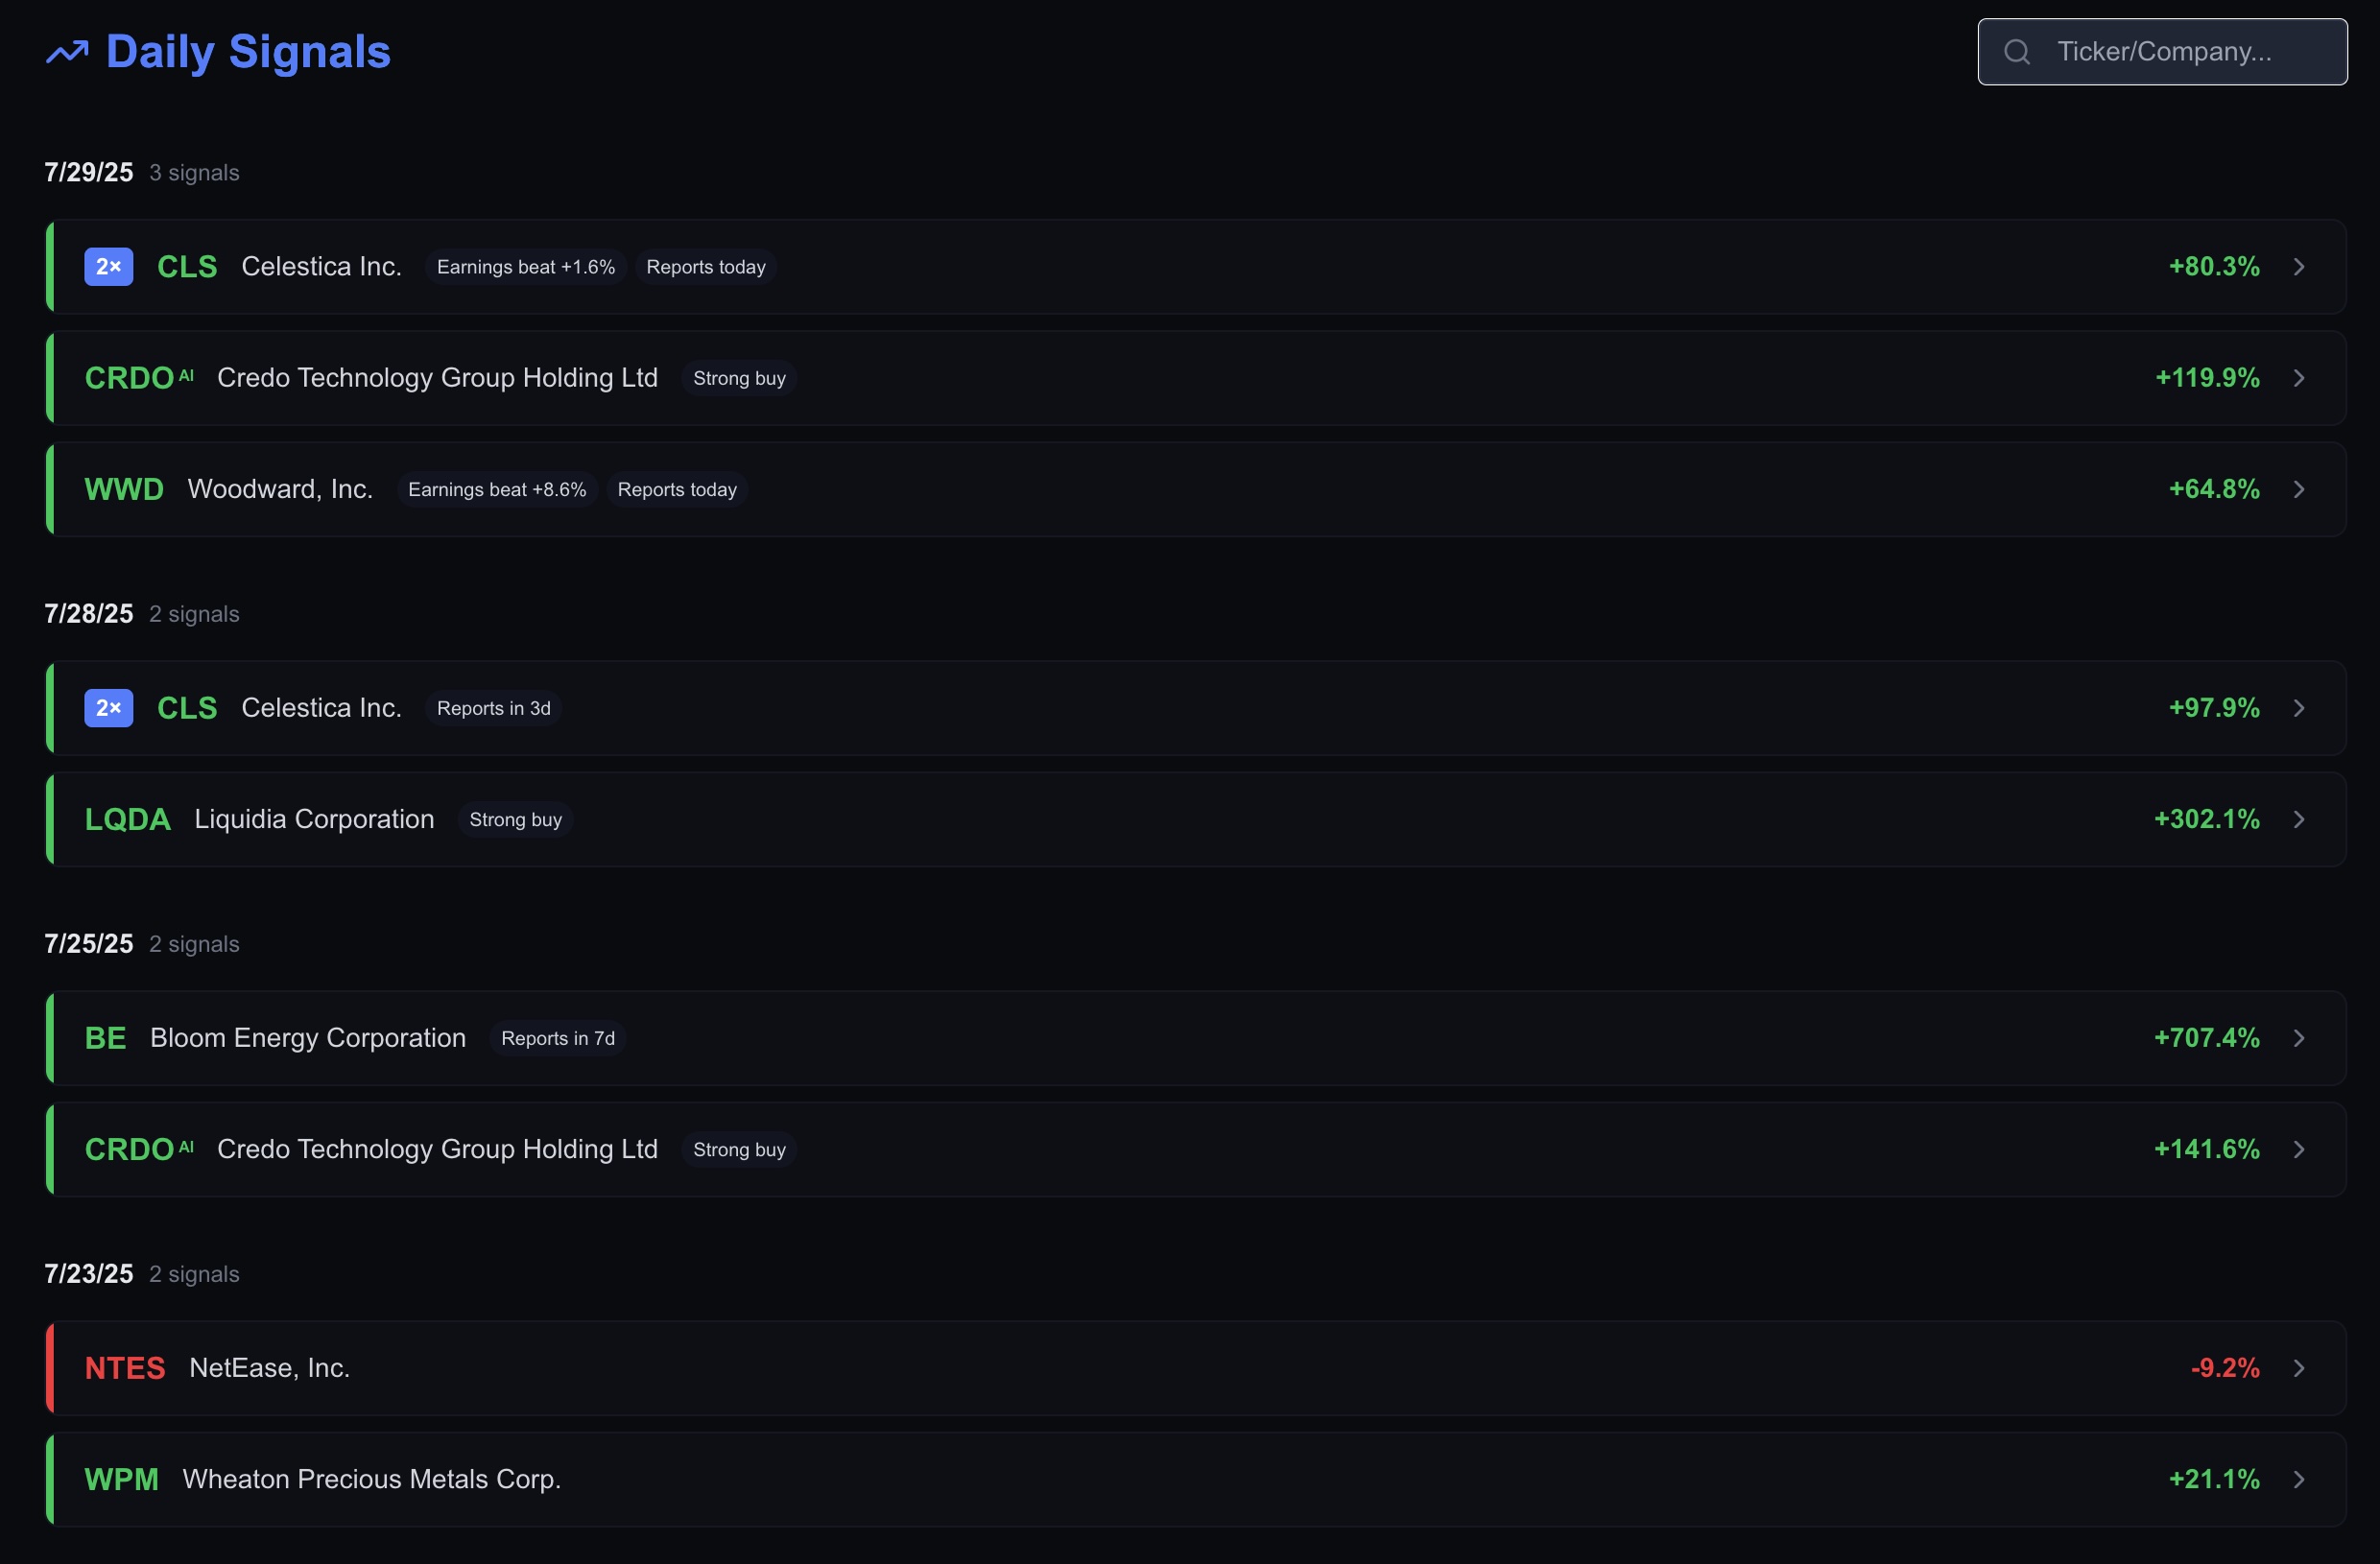
Our models scan the whole U.S. market each morning and rank the strongest setups. The best ideas are always at the top of the page.
The scorecard
Fresh signals watched to develop for the first 90 days and held for 1 year.
Every buy signal is entered at the next open and held 12 months, then counted — win or lose. These are backtested results across roughly eight years of history.
73.4%
backtested win rate across 323 graded buy signals
- Winners
- 237
- Losers
- 86
- Average winner
- +70.8%
- Average loser
- −27.8%
- Median return
- +32.0%
- S&P 500, same period
- +14.4%
- Track record
- Jan 2018 – 2026 (~8 years)
On Defensive days
A separate record for Defensive days appears once 100 signals entered on such days have been graded.
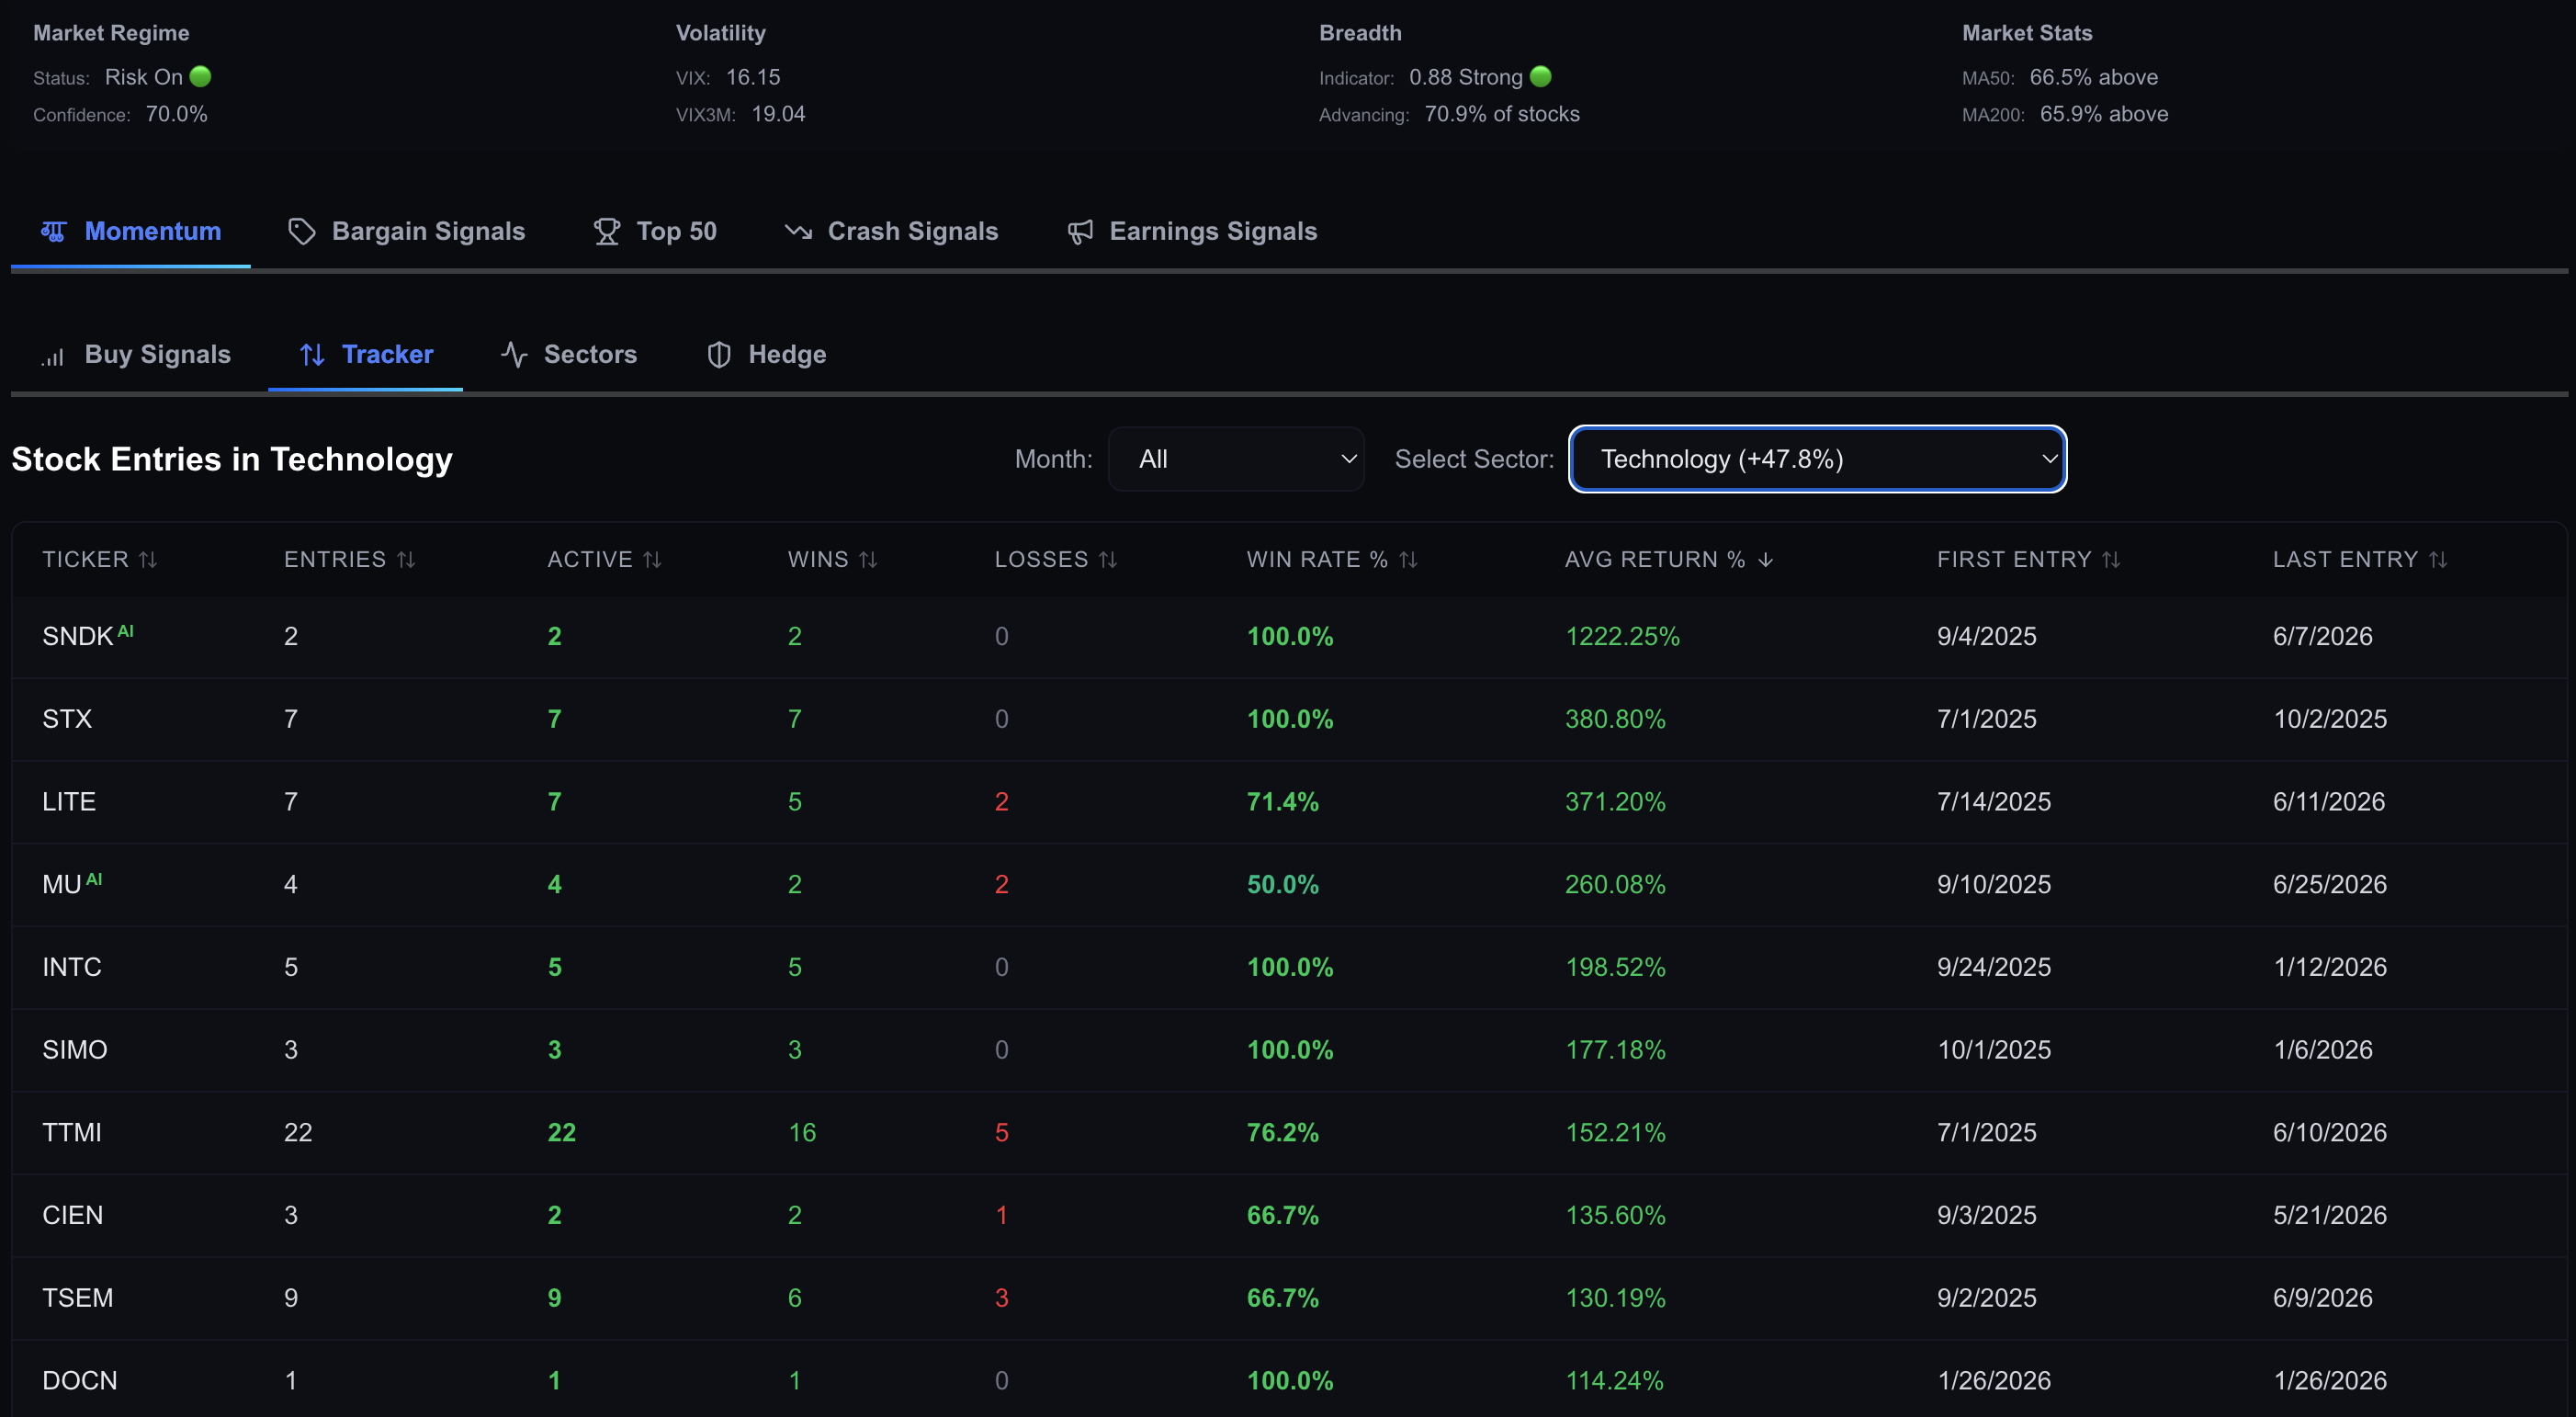
How these figures were made
Backtested results — not the performance of any live account or actual trades. One signal = one ticker on one entry day. Each signal is entered at the next session’s opening price and held for 12 months; returns shown are realized (closed) results only. Signals are graded only after they are at least 90 days old — fresh calls are not scored. Coverage: 323 completed buy signals entered between January 2018 and June 2025 (each held 12 months, so results run through mid-2026) — an ~8-year period. “S&P 500, same period” is the return of SPY over each signal’s own entry-to-exit holding window, averaged across all signals. Results are gross — no commissions, fees, slippage, or taxes are deducted — and reflect strategy rules developed using this same historical data (in-sample). Past performance is not indicative of future results, and hypothetical results have inherent limitations.
How it works
Three steps, every trading day.
Check the morning list
Before the open, BuySignal ranks the strongest setups across the U.S. market: dated, scored, and published as they fire.
See the full setup
Each ticker gets five lenses: timing, valuation, momentum, sentiment, and quality — plotted directly on the chart.
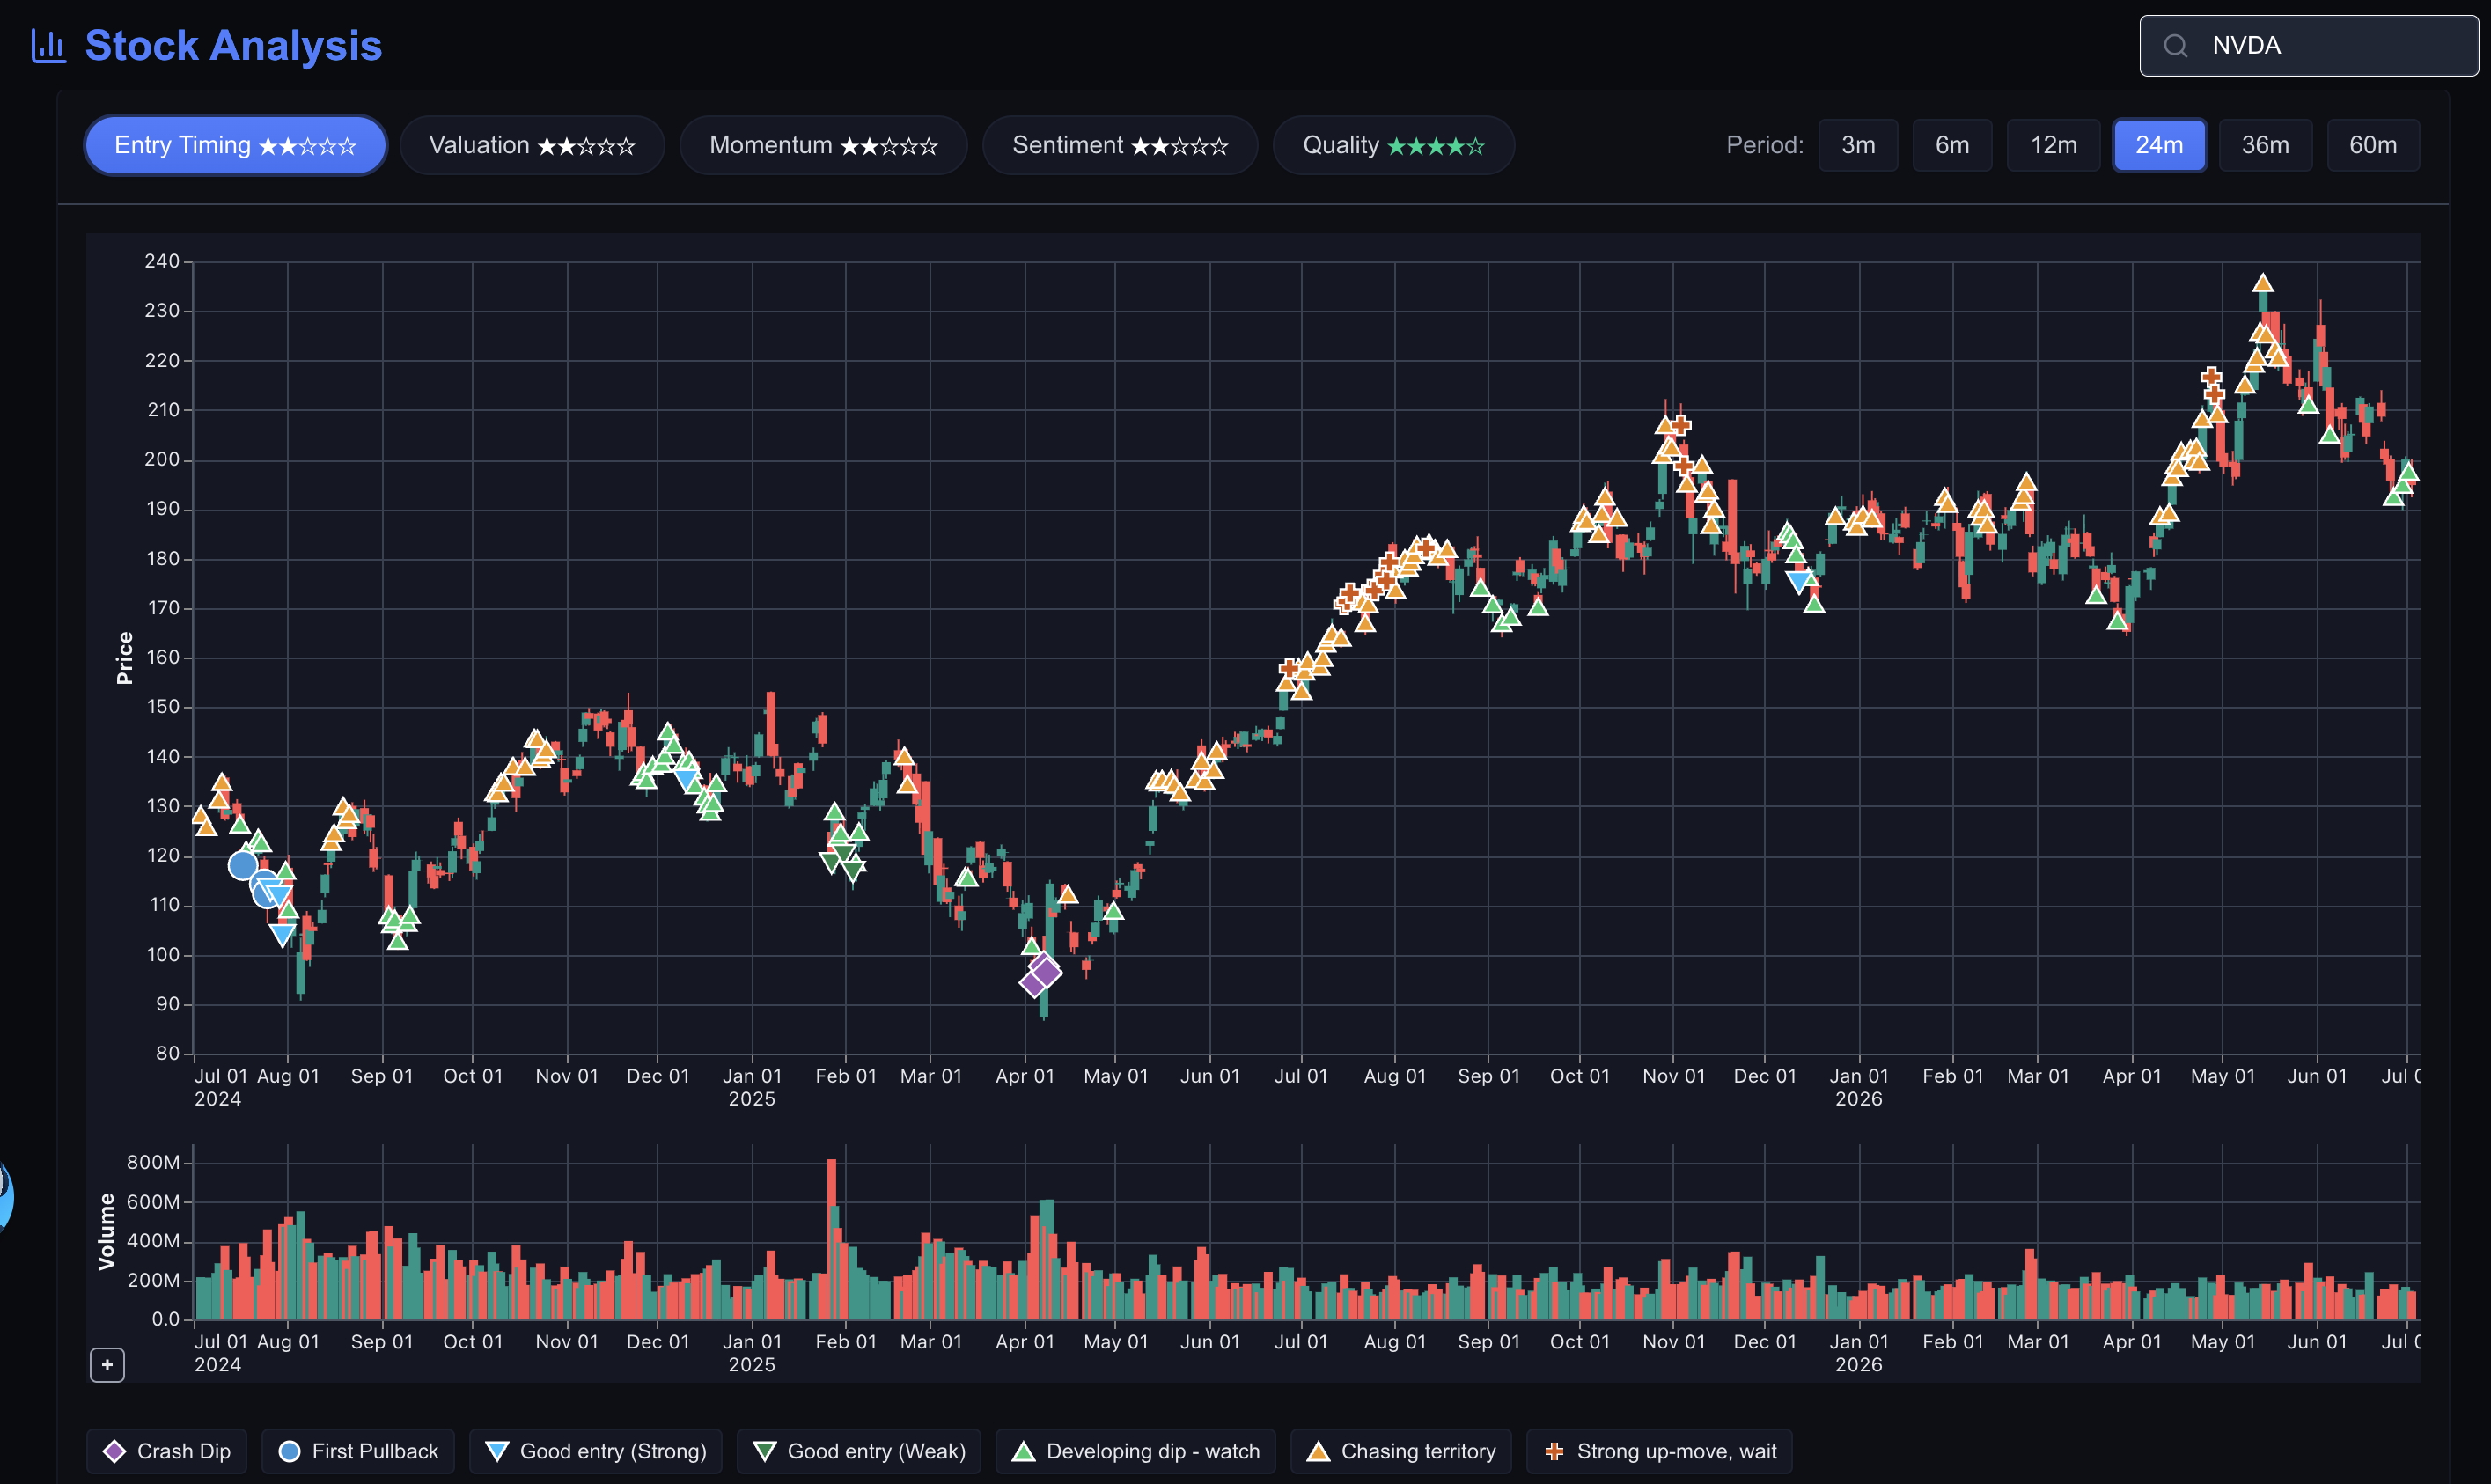
Track the outcome
Every signal is followed forward with real prices: entry date, return, win/loss status, and days held.
Ask the data
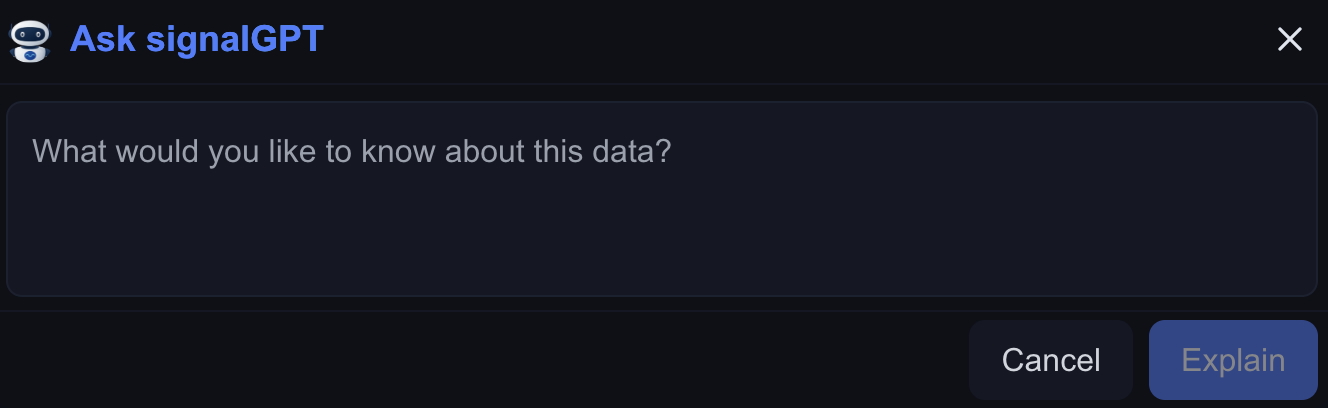
SignalGPT answers questions using the same market, sector, and signal data behind the app. Ask why a signal fired, what changed in a sector, or how a ticker scores — in plain English.
Try asking
- “How have my watchlist stocks held up since Nov 3?”
- “Which of today’s signals are in sectors holding up best?”
- “Explain today’s market reading in plain English.”
- Real-time momentum read on any ticker
- Market reading and sector rotation explained clearly
- Lives inside the signal pages, charts, and screeners
AI provides data-driven research, not personalized investment advice.
Watch us keep score.
Free during beta. No credit card — just your email. We’ll invite the next batch weekly.
Find us on X @maxbuysignal and Substack.